What the Government's Own Data Is Telling Retail Property Owners Right Now
Week of March 2, 2026 | By Ray Kang, CCIM
This past week delivered something unusual: two major official government data releases on the same day, landing alongside the University of Michigan's monthly consumer survey. For retail property owners and CRE investors, these three sources together tell a story worth reading carefully — and the story is more nuanced than what you'll find in most headlines.
I focus on retail strip centers in San Antonio, Austin, and the Rio Grande Valley. My clients are private owners who need timely market intelligence — not noise, not spin. So this week, I'm going straight to the primary sources: no partisan media, no aggregators. Just the data, in plain language, and what it actually means for your investment.
What the Official Data Is Saying About the U.S. Consumer
Source: U.S. Census Bureau
Retail Sales: The Headline Was Soft. The Signal Underneath It Was Not.
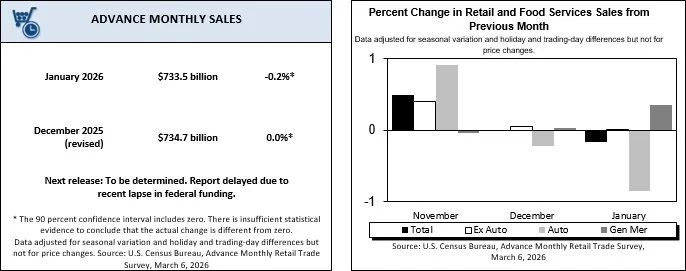
On March 6th, the U.S. Census Bureau released its advance monthly retail sales estimate for January 2026. Total retail and food services sales came in at $733.5 billion — down 0.2% from December. Gas stations fell 2.9%, autos fell 0.9%, and clothing and accessories dropped 1.7%. On the surface, a weak number.
But here's what you should actually be watching: the "control group" measure — which excludes autos, gas, building materials, and food service, and feeds directly into GDP calculations — rose 0.3% in January. This is the figure economists use to assess underlying consumer demand, stripped of the volatile categories that distort the headline.
And year-over-year? Total retail sales are up 3.2% from January 2025. The three-month trend from November through January is up 2.9% versus the same period a year prior. Winter weather disruptions played a role in the monthly softness; the Census Bureau noted that directly.
The takeaway: Don't let a soft monthly headline spook you. The underlying demand signal held positive. When the control group turns negative and stays negative, that's the real warning sign. It hasn't yet.
Source: U.S. Census Bureau — Advance Monthly Sales for Retail and Food Services, January 2026
The February Jobs Report: 92,000 Jobs Lost — Read the Fine Print

The Bureau of Labor Statistics released the February 2026 Employment Situation on the same morning. Total nonfarm payrolls fell by 92,000 positions, and the unemployment rate edged up to 4.4%.
That's the headline. Here's the context the BLS provided directly in the report:
Healthcare employment — which had been averaging 36,000 new jobs per month over the prior year — fell in February due to strike activity. That's a temporary disruption, not a structural shift. Employment in information and federal government continued a trend downward that has been building for several months.
Average hourly earnings rose 0.4% in February and are up 3.8% year-over-year. With the Consumer Price Index running around 2.4%, workers who have jobs are still seeing real wage growth — their purchasing power is expanding, not contracting.
The takeaway: This is a yellow flag, not a red one. Softening labor markets eventually show up in retail traffic. If this trend continues for another two to three months, it warrants a more defensive posture. For now, it's a data point to monitor closely — not a signal to panic over.
Source: Bureau of Labor Statistics — The Employment Situation, February 2026
Consumer Sentiment: Stagnant at the Surface — Deeply Divided Underneath
Source: University of Michigan
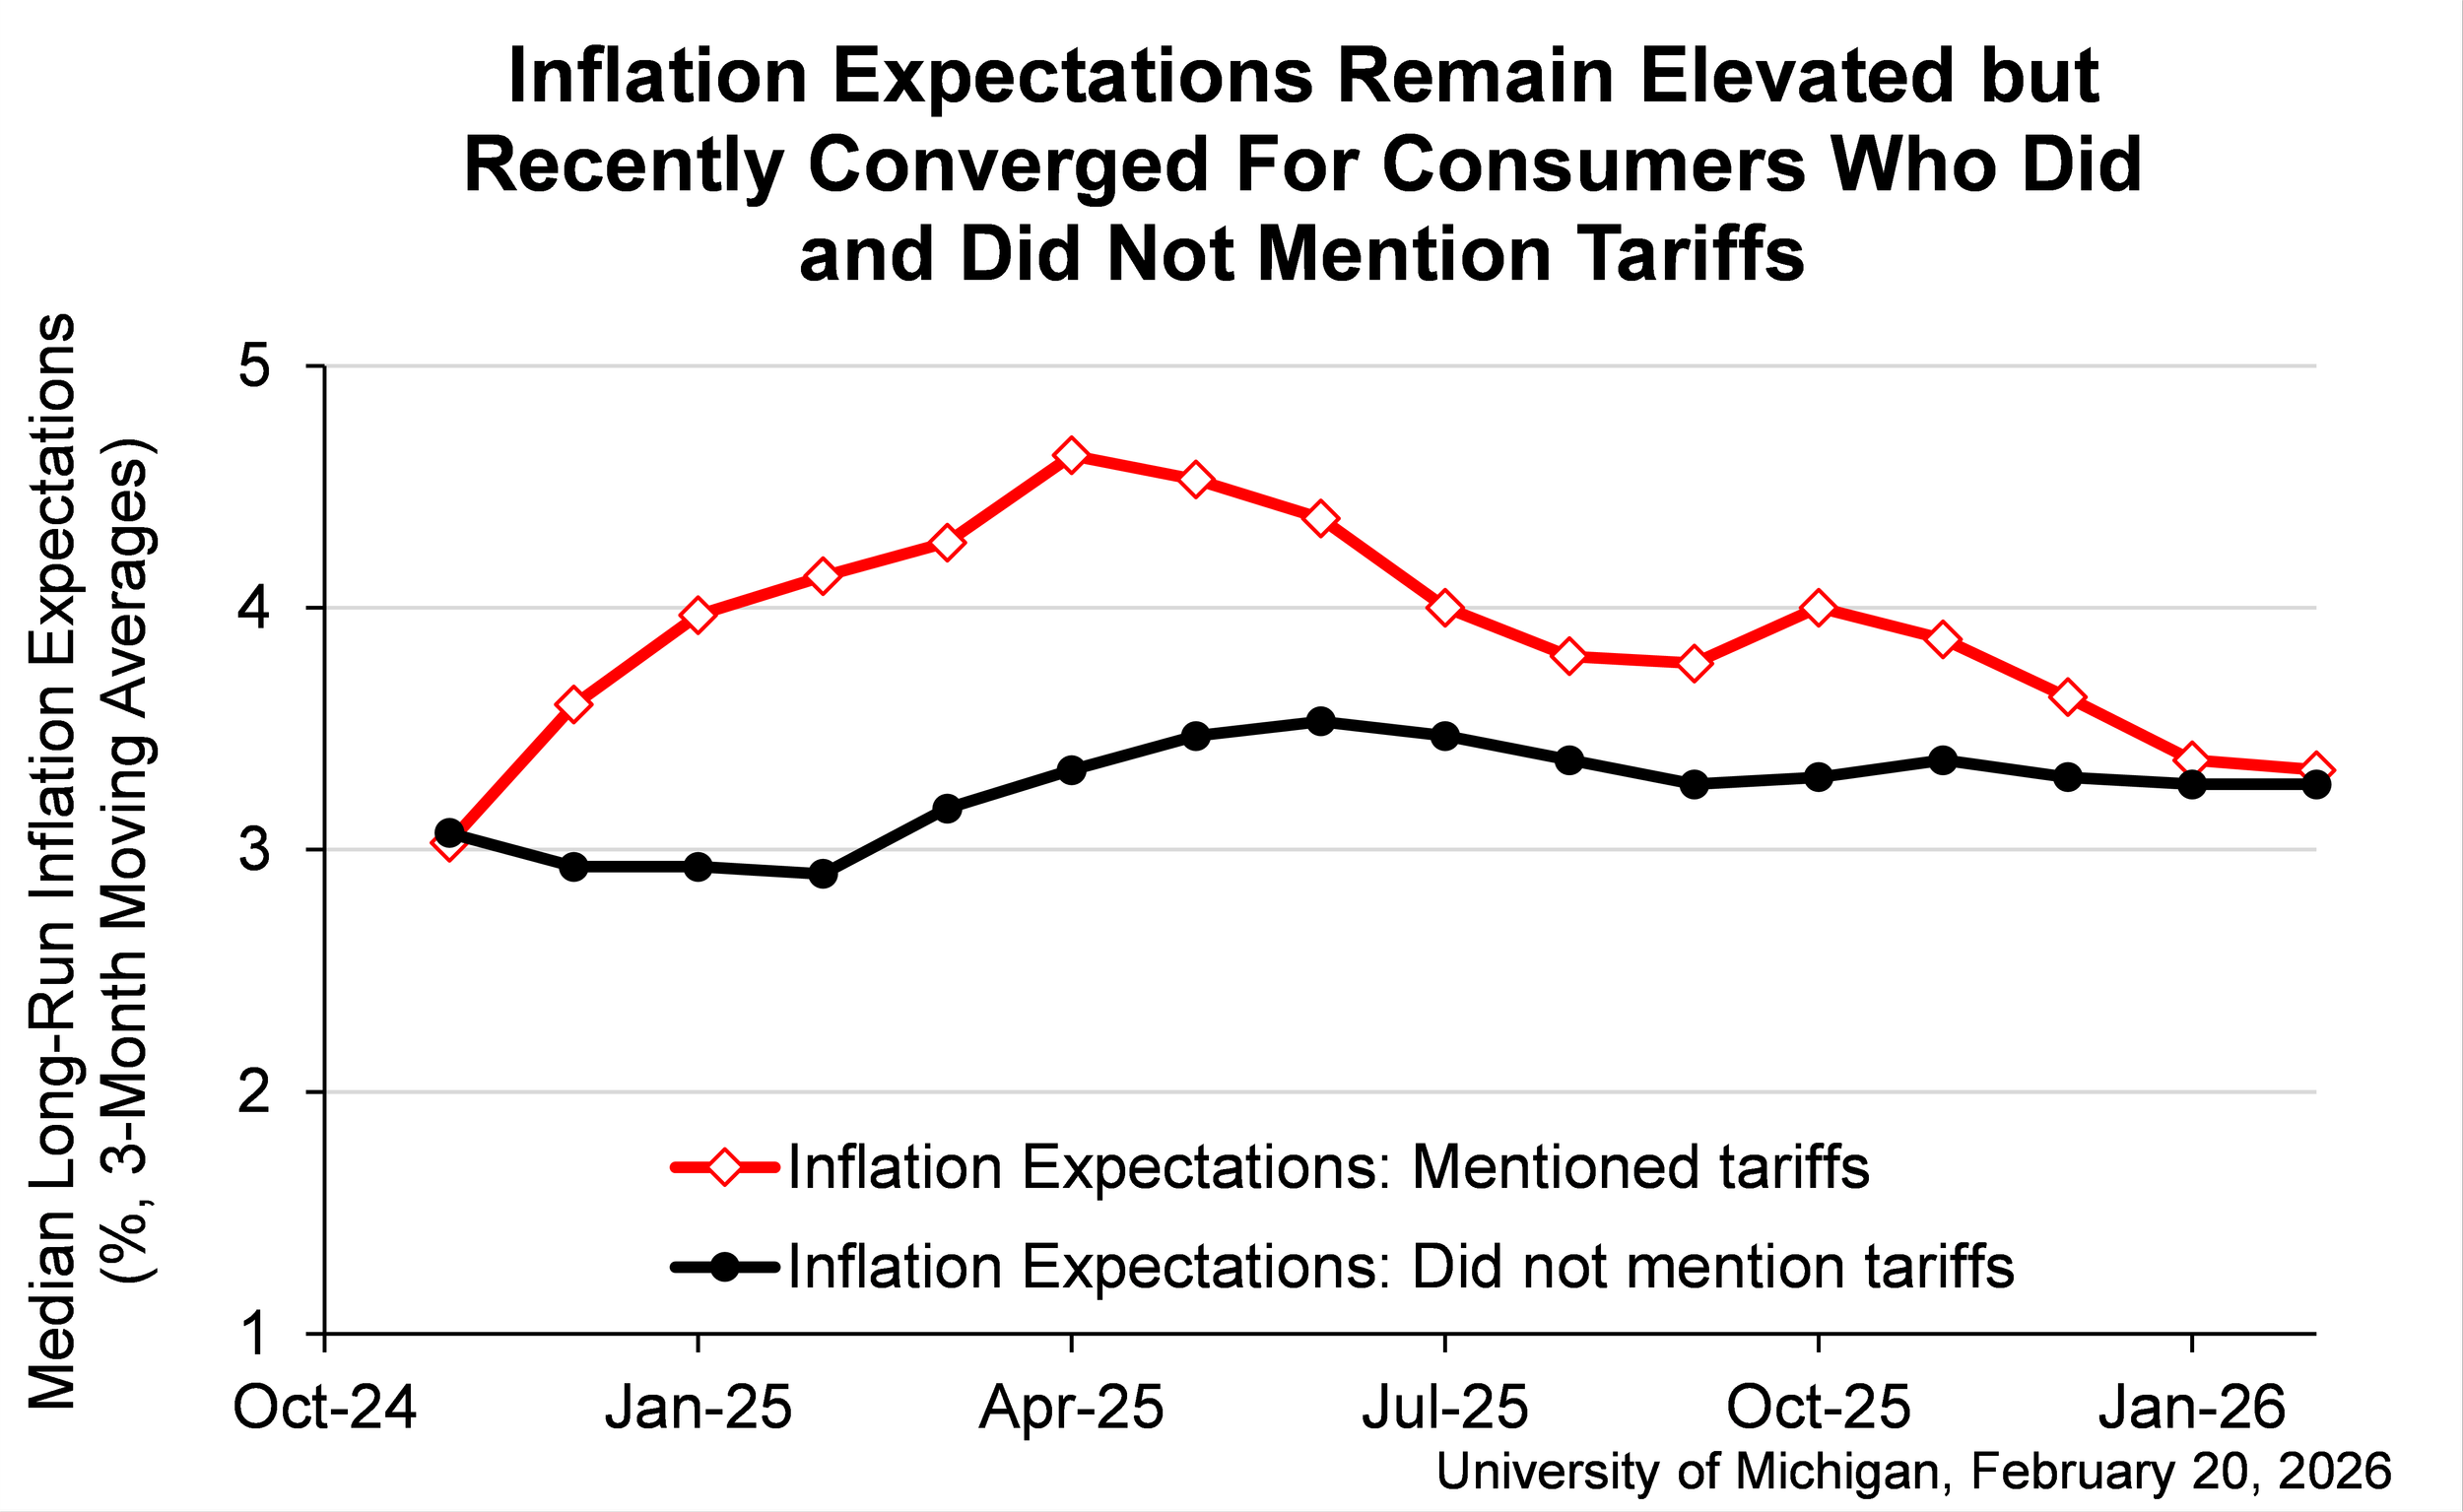
The University of Michigan's Surveys of Consumers is one of the country's oldest and most respected measures of consumer psychology, running since 1949. February's final reading held at 56.6 — virtually unchanged from January's 56.4, and 13% below where it was a year ago.
The U of M's own economist, Joanne Hsu, described sentiment as having "stagnated." About 46% of survey respondents spontaneously cited high prices as a strain on personal finances — a reading that has exceeded 40% for seven consecutive months in a row.
But here's the finding that matters most for retail property owners: the income divergence.
Sentiment among the wealthiest consumers (large stockholders) improved in February, while sentiment among non-stockholders declined. According to the U of M, sentiment for the wealthiest consumers is now more than 30% higher than sentiment for non-stockholders. Higher-income, equity-holding households feel meaningfully better about the economy. Budget-constrained households do not.
The takeaway: Your tenant mix either captures the resilient spender or the squeezed one. That distinction — more than brand names, more than lease terms — is shaping leasing demand and renewal risk right now. Know which consumer your tenants serve.
Source: University of Michigan — Sentiment Stagnates, Wealth Gaps Grow, February 2026

What's Happening in the Restaurant and Retail Industry
Pizza Hut: 250 U.S. Closures in the First Half of 2026
On Yum Brands' Q4 2025 earnings call, CFO Ranjith Roy announced that Pizza Hut will close 250 U.S. restaurants in the first half of 2026 as part of a program called "Hut Forward." The strategy includes marketing investment, technology modernization, and franchise agreement restructuring.
The numbers behind the decision tell the story: Pizza Hut's U.S. same-store sales fell 5% in 2025. System sales fell 7% year-over-year. Yum Brands is also conducting a strategic review of the brand that could result in a sale.
This is not a minor adjustment. This is a brand making systematic decisions about which real estate to keep and which to walk away from. For strip center owners, it's a reminder that mid-tier QSR tenants — even legacy brands with decades of operating history — can pivot quickly on their real estate footprints when the unit economics break down.
Source: Restaurant Business Online — Pizza Hut Is Closing 250 U.S. Restaurants
The National Restaurant Association's 2026 Outlook: Structural Pressure, Not Just a Rough Quarter
The National Restaurant Association — the industry's leading trade organization, founded in 1919, representing more than one million restaurant and foodservice outlets — published its 2026 State of the Restaurant Industry report. This is the authoritative annual benchmark for the sector.
Key findings:
Total restaurant sales projected at $1.55 trillion in 2026 — but real, inflation-adjusted growth is forecast at only 1.3%. The NRA's own language: "measured growth."
More than 9 in 10 operators cite food costs, labor, insurance, energy, and payment processing fees as significant business challenges.
Consumers — particularly lower- and middle-income households — are described as "increasingly stretched."
More than 7 in 10 consumers say they would visit restaurants more frequently if they had more disposable income.
That last number is the one I keep coming back to. The demand exists. The problem is household budget pressure. The gap between desire and ability to spend is exactly what is forcing operators to shed their weakest real estate. The NRA's chief economist put the consumer environment plainly: "Comfort and value are the twin pillars shaping America's menus right now." That's not just a culinary trend — it's a real estate footprint story.
The broader closure picture across the industry supports this: Wendy's is reviewing up to 300 locations, Jack in the Box is cutting up to 200, Bloomin' Brands' Outback Steakhouse is walking away from 21–22 leases through 2030, and FAT Brands filed Chapter 11 in January 2026 — permanently closing 32 company-owned locations and rejecting all associated leases in U.S. Bankruptcy Court.
Source: National Restaurant Association — 2026 State of the Restaurant Industry
What This Means for Your Strip Center Portfolio

Three practical questions for retail property owners to be asking right now:
1. Does your casual dining or QSR tenancy include any brands on active closure review? If so, now is the time for a proactive conversation — not when you get a surprise notice. Audit your rent roll against the brands that have publicly announced closure programs. Know where your exposure is.
2. How does your tenant mix align with the income divergence the University of Michigan is documenting? Centers anchored by tenants serving higher-income, equity-holding households are buffered. Centers that primarily serve budget-constrained households need either a stronger value-oriented anchor or a more defensive leasing strategy going into the next renewal cycle.
3. Do you have dark boxes or near-term lease expirations on restaurant space? The repositioning window to medical, dental, beauty services, and specialty fitness is open right now — and the demand from those expanding tenant categories is active across San Antonio, Austin, and the Rio Grande Valley. These operators can sign long leases and bring stability that a second food-service user in a challenged category cannot. Don't wait for the market to tell you what the data is already telling you.
The Bottom Line
The data this week tells you to stay close to your rent roll. Not because the sky is falling — the control group metric is still positive, real wages are still positive, and total retail sales are up year-over-year. But the divergence between tenants and consumers who are holding up versus those who are under pressure is widening. The landlords who act proactively are the ones who protect their NOI through the cycle.
All sources cited in this post are primary government data (Census Bureau, BLS), peer-recognized academic research (University of Michigan Surveys of Consumers), or the restaurant industry's own trade organization (National Restaurant Association). I publish this analysis every week because my clients deserve timely, unspun market intelligence — not noise.
Ray Kang, CCIM Commercial Real Estate Investment Sales | Retail Strip Centers San Antonio • Austin • Rio Grande Valley
→ Subscribe to StripCenterIQ for weekly retail CRE market analysis: www.stripcenteriq.com → Contact Ray to discuss your portfolio: raycrebroker.com
© 2026 Ray Kang, CCIM. All rights reserved. This content is for informational purposes only and does not constitute investment advice.
Watch or Listen on Youtube.